On this page
Semantic Graph Tab Reference
Purpose
The Semantic Graph tab builds and explores a knowledge graph of the binary’s functions, call relationships, data flows, and security characteristics. It provides four sub-views for different exploration modes, plus tools for automated security, network, and community analysis.
Top Controls
Present across all sub-views:
| Element | Description |
|---|---|
| Current | Text field showing the selected function. Type a name or address and click Go to navigate. |
| Status bar | Shows index statistics: node count, caller/callee counts, flag counts. |
Bottom Controls
| Button | Description |
|---|---|
| Reset Graph | Delete all indexed data for this binary. |
| ReIndex Binary | Run the full indexing pipeline: extract structure, call graph, cross-references. |
| Semantic Analysis | Generate LLM summaries for all unsummarized functions. Shows a progress bar. |
| RAG checkbox | Include RAG context during semantic analysis. |
| MCP checkbox | Allow MCP tool use during semantic analysis. |
| Force re-analysis checkbox | Re-analyze functions that already have summaries. |
Graph Stats display: X nodes | Y edges | Z stale | Last: YYYY-MM-DD HH:MM:SS
Sub-Views
1. List View
A detail panel for the currently selected function with four sections:
Left Column (60%):
| Section | Description |
|---|---|
| Callers | Functions that call the current function. Double-click to navigate. |
| Callees | Functions called by the current function. Double-click to navigate. |
| Edges | Table of all edges involving this function, with type filtering. |
Edge types: calls, references, calls_vulnerable, taint_flows_to, similar_purpose, network_send, network_recv
Right Column (40%):
| Section | Description |
|---|---|
| Security Flags | Checkboxes for known security flags. Click to toggle. |
| + Add Custom Flag | Add a custom security flag to this function. |
| LLM Summary | The LLM-generated explanation of this function. |
| Edit / Save | Toggle between read and edit mode for the summary. |
Known Security Flags: - BUFFER_OVERFLOW_RISK - COMMAND_INJECTION_RISK - FORMAT_STRING_RISK - USE_AFTER_FREE_RISK - PATH_TRAVERSAL_RISK - INTEGER_OVERFLOW_RISK - NULL_DEREF_RISK - MEMORY_LEAK_RISK - RACE_CONDITION_RISK - HANDLES_USER_INPUT - PARSES_NETWORK_DATA - CRYPTO_OPERATION - AUTHENTICATION
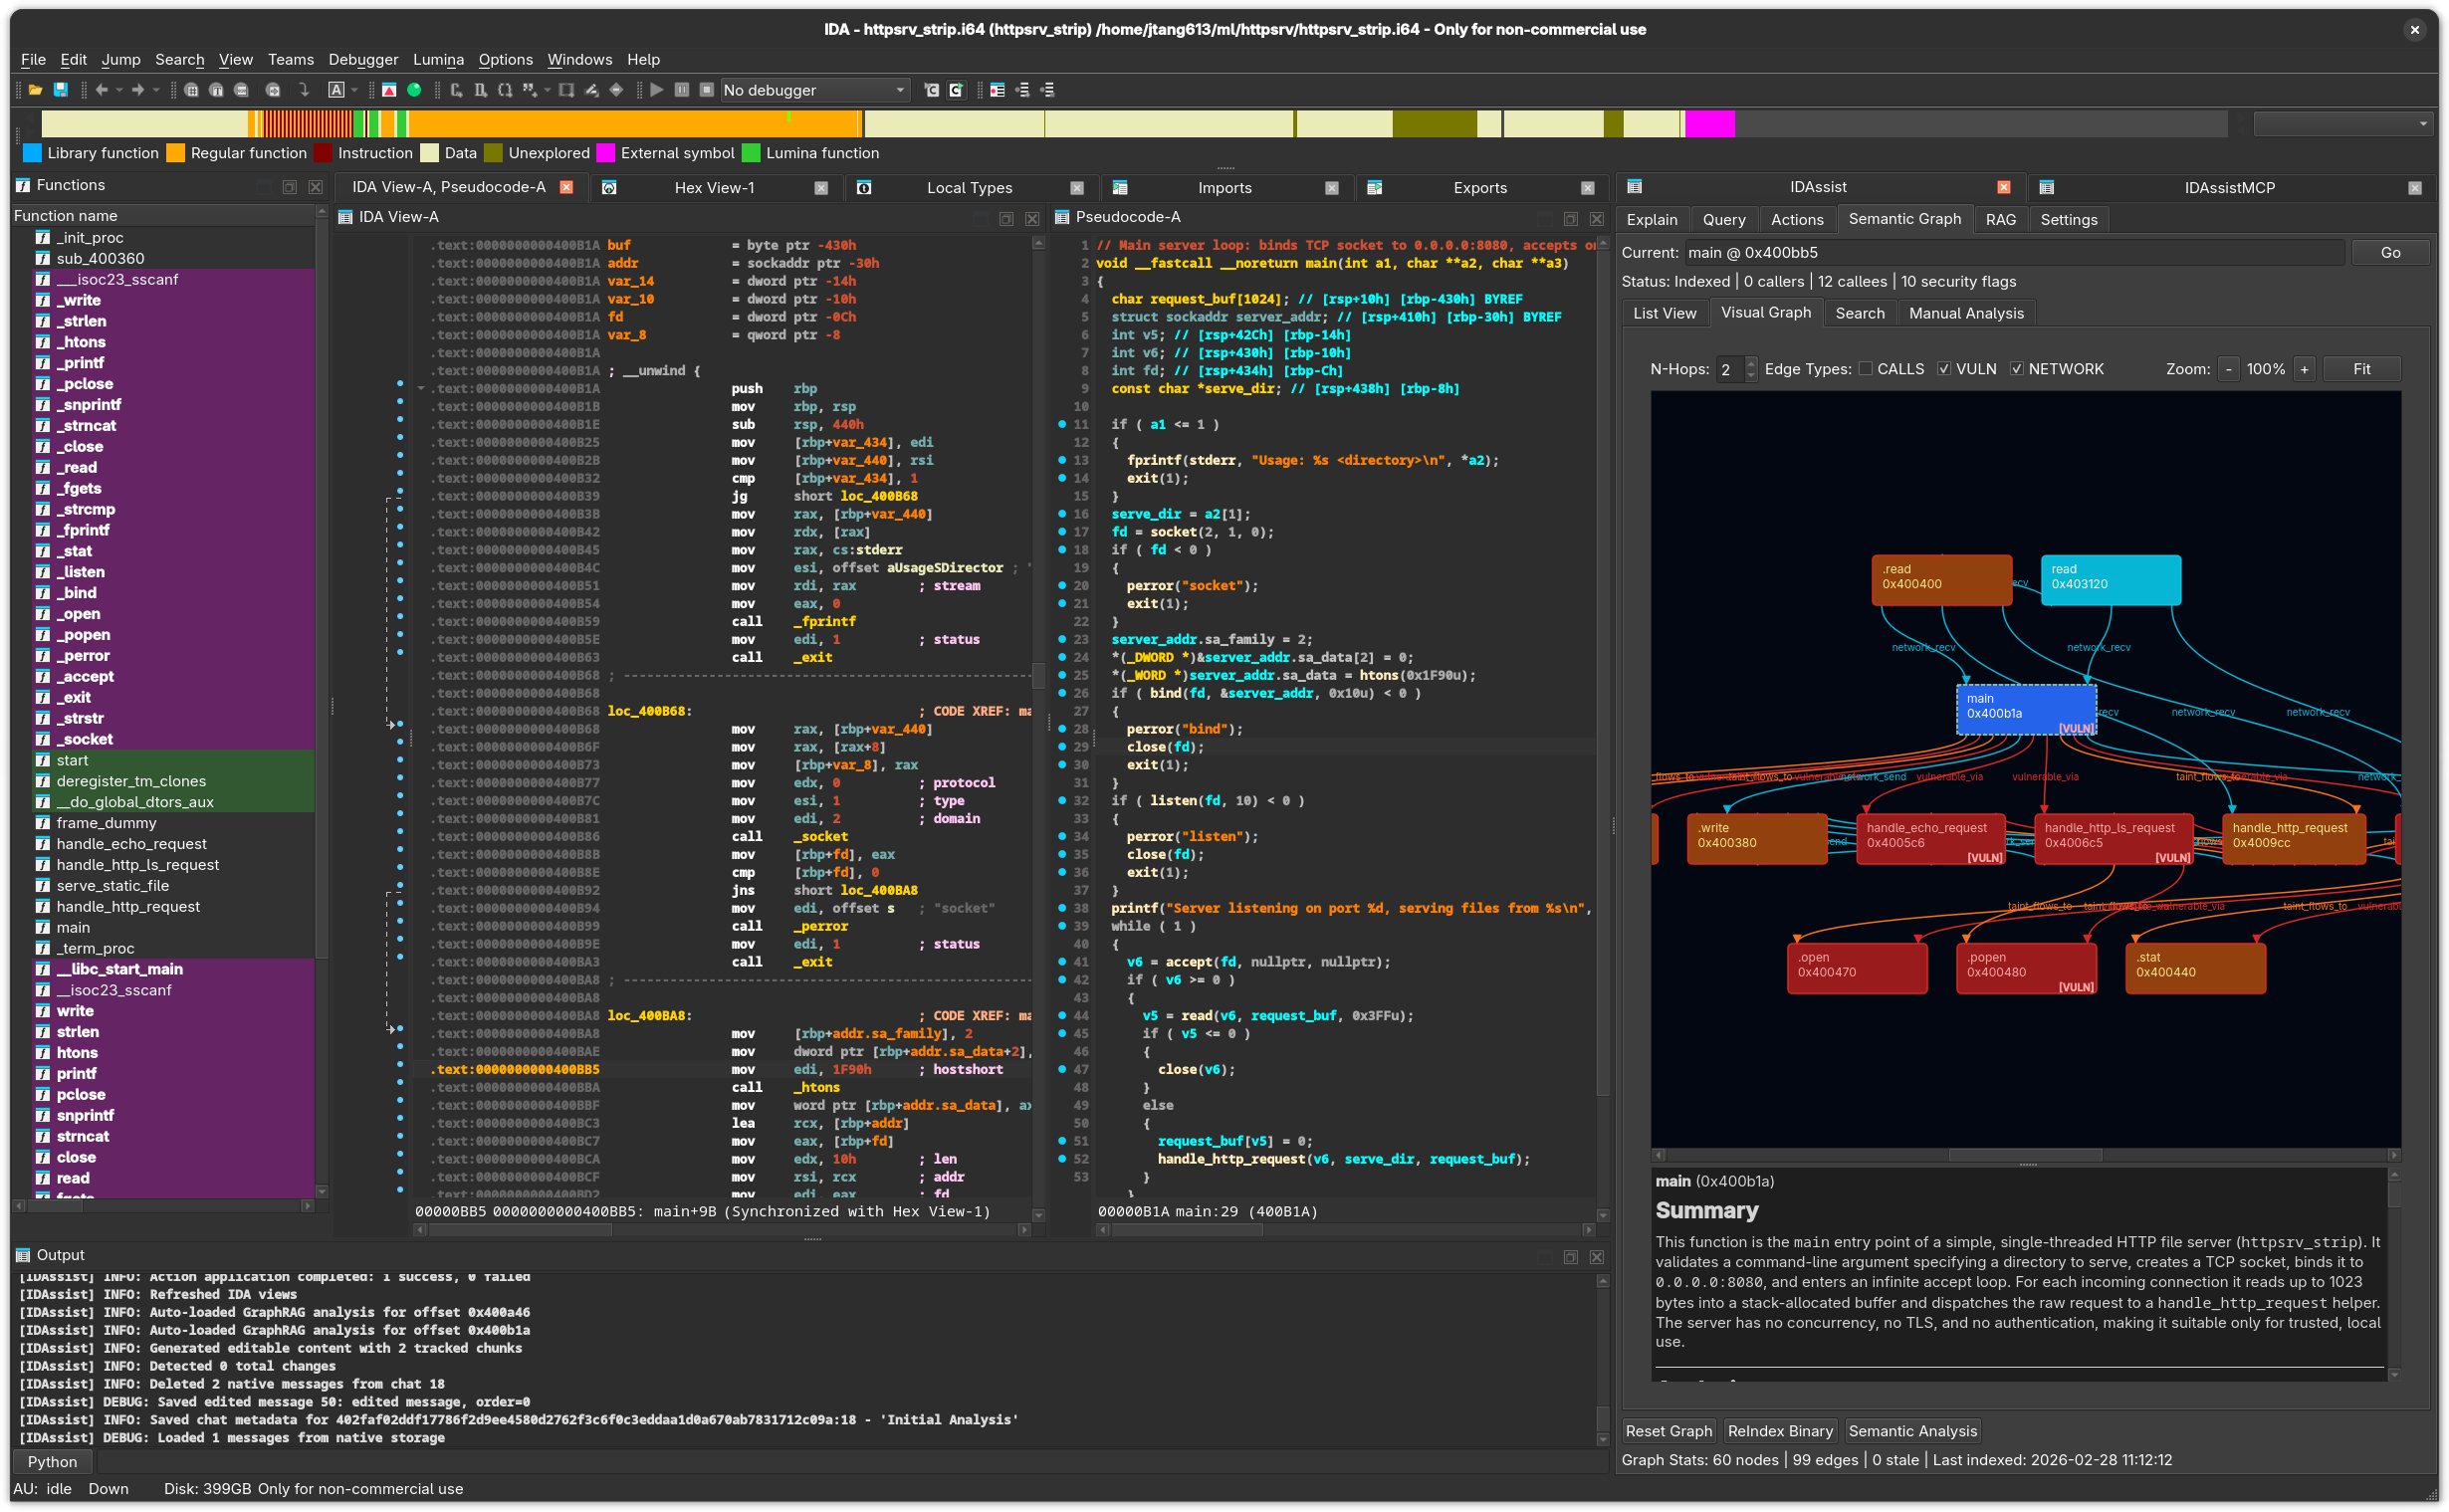
2. Visual Graph
An interactive QGraphicsView displaying function nodes and relationship edges.
Controls:
| Control | Description |
|---|---|
| N-Hops spinner | Expansion depth (1–5 hops from the center function). |
| CALLS checkbox | Show/hide call edges. |
| VULN checkbox | Show/hide vulnerability-related edges. |
| NETWORK checkbox | Show/hide network flow edges. |
| Zoom buttons | Zoom in (-), reset (100%), zoom out (+), fit to view (Fit). |
Visual Theme:
| Element | Color | Meaning |
|---|---|---|
| Background | #1f2123 |
Dark theme |
| Normal node | #3a3f44 |
Standard function |
| Center node | #2ea8b3 |
Currently selected function |
| Vulnerable node | #7a2b2b |
Function with security flags |
| Call edges | #58a6ff |
Function calls |
| Reference edges | #7a7f87 |
Data/code references |
| Vulnerability edges | #ff5c5c |
Vulnerability-related relationships |
- Uses Graphviz (
dotcommand) for layout when available, falls back to BFS layout - Curved edges with arrowheads
- Double-click any node to navigate to that function in IDA
- Summary panel below shows the selected node’s function name, address, and LLM summary
3. Search View
Query the knowledge graph with seven search types:
| Query Type | Description |
|---|---|
| Semantic Search | Find functions by natural-language description. |
| Get Analysis | Retrieve the stored analysis for a specific function. |
| Similar Functions | Find functions with similar behavior or structure. |
| Call Context | Explore callers and callees at a given depth. |
| Security Analysis | Find functions matching security patterns. |
| Module Summary | Summarize a group of related functions. |
| Activity Analysis | Analyze function activity patterns (network, file I/O). |
Parameters:
| Field | Description |
|---|---|
| Query | Search text or natural-language description. |
| Address | Target function address. Use Current Address checkbox auto-fills. |
| Limit | Maximum results (1–100, default 20). |
| Depth | Call graph depth (1–5, default 1). |
| Direction | Call graph direction: both, callers, or callees. |
| Scope | Analysis scope: function or binary. |
Results Table: #, Function, Address, Score, Summary
Click a result row to see full details in the panel below. Click Go To to navigate to that address in IDA.
4. Manual Analysis Panel
Run targeted analyses with individual buttons and progress indicators:
| Button | Description |
|---|---|
| Security Analysis | Detect vulnerability patterns and security-relevant API calls. |
| Network Flow | Trace network operations across the call graph. |
| Community Detection | Group related functions into logical modules. |
| Refresh Names | Update graph node labels to match current IDB names. |
Each button shows a progress indicator during execution.
Analysis Pipeline
The full analysis pipeline (triggered by ReIndex Binary + Semantic Analysis) runs these phases:
- Structure extraction — Function boundaries, call graph, cross-references
- Semantic analysis — LLM summaries for each function
- Security feature extraction — Vulnerability pattern detection
- Network flow analysis — Network API tracing
- Taint analysis — Data flow tracking
- Community detection — Module grouping
IDA-Specific Details
- Functions are indexed via
idautils.Functions()which iterates all recognized functions - Double-clicking a node or search result calls
ida_kernwin.jumpto(ea)to navigate - Function names are read via
ida_name.get_name(ea) - Cross-references use
ida_xreffor both code and data xrefs - The IDB hook
renamed()notifies the graph when functions are renamed, keeping labels in sync
Related Documentation
- Semantic Graph Workflow — Step-by-step graph building guide
- Explain Tab — Individual function explanations
- RAG Tab — Add documents for enriched semantic analysis
- Settings Tab — Configure LLM provider for semantic analysis