On this page
Workflow: Building a Semantic Graph
This guide walks you through building and using a semantic graph of your binary, enabling rich contextual understanding and security analysis.
Overview
The Semantic Graph creates a knowledge base of your binary that captures:
- Function information and relationships
- LLM-generated summaries and categorizations
- Security flags and risk assessments
- Taint analysis paths for vulnerability detection
- Function communities and modules
This graph enhances LLM queries and enables structured exploration of the binary.
When to Build a Semantic Graph
Build a semantic graph when you want to:
- Understand a binary’s overall structure
- Find security-relevant functions systematically
- Enable rich context for LLM queries
- Identify related function groups
- Trace data flows for vulnerability analysis
Step-by-Step Workflow
Step 1: Open the Semantic Graph Tab
Navigate to the Semantic Graph tab in BinAssist. You’ll see the List View sub-tab with an empty or previously populated function list.
Step 2: ReIndex the Binary
Click ReIndex Binary in the Manual Analysis panel to build the foundation.
This process: 1. Extracts all functions from the binary 2. Records function addresses, names, and sizes 3. Builds the call graph (CALLS edges) 4. Identifies imports and exports
The time required depends on binary size: - Small binaries (< 100 functions): A few seconds - Medium binaries (100-1000 functions): Under a minute - Large binaries (1000+ functions): Several minutes
Step 3: Run Semantic Analysis
Click Semantic Analysis to generate LLM-powered summaries.
For each function, the LLM generates: - Purpose summary - Activity profile (what the function does) - Security flags (network, file I/O, crypto, etc.) - Risk assessment
This step is LLM-intensive and may take time for large binaries. Progress is shown in the status area.
Step 4: Run Security Analysis
Click Security Analysis to perform taint analysis.
This process: 1. Identifies sources (functions that receive external input) - Network receive functions (recv, read from socket) - File read functions - User input functions 2. Identifies sinks (potentially dangerous operations) - strcpy, sprintf (buffer overflows) - system, exec (command injection) - SQL functions (injection) 3. Traces paths from sources to sinks 4. Creates TAINT_FLOWS_TO and VULNERABLE_VIA edges
Discovered vulnerability paths are stored in the graph for review.
Step 5: Run Community Detection
Click Community Detection to group related functions.
Using the Label Propagation algorithm, this: 1. Analyzes call relationships 2. Groups functions that frequently interact 3. Labels communities by common purpose
Communities help you understand the binary’s modular structure: - “Network I/O” - functions handling network communication - “Crypto” - cryptographic operations - “File Operations” - file system interactions - “String Processing” - string manipulation functions
Exploring the Graph
List View
Browse all indexed functions: - Click a row to see callers and callees - Sort by clicking column headers - Use the table to navigate the binary
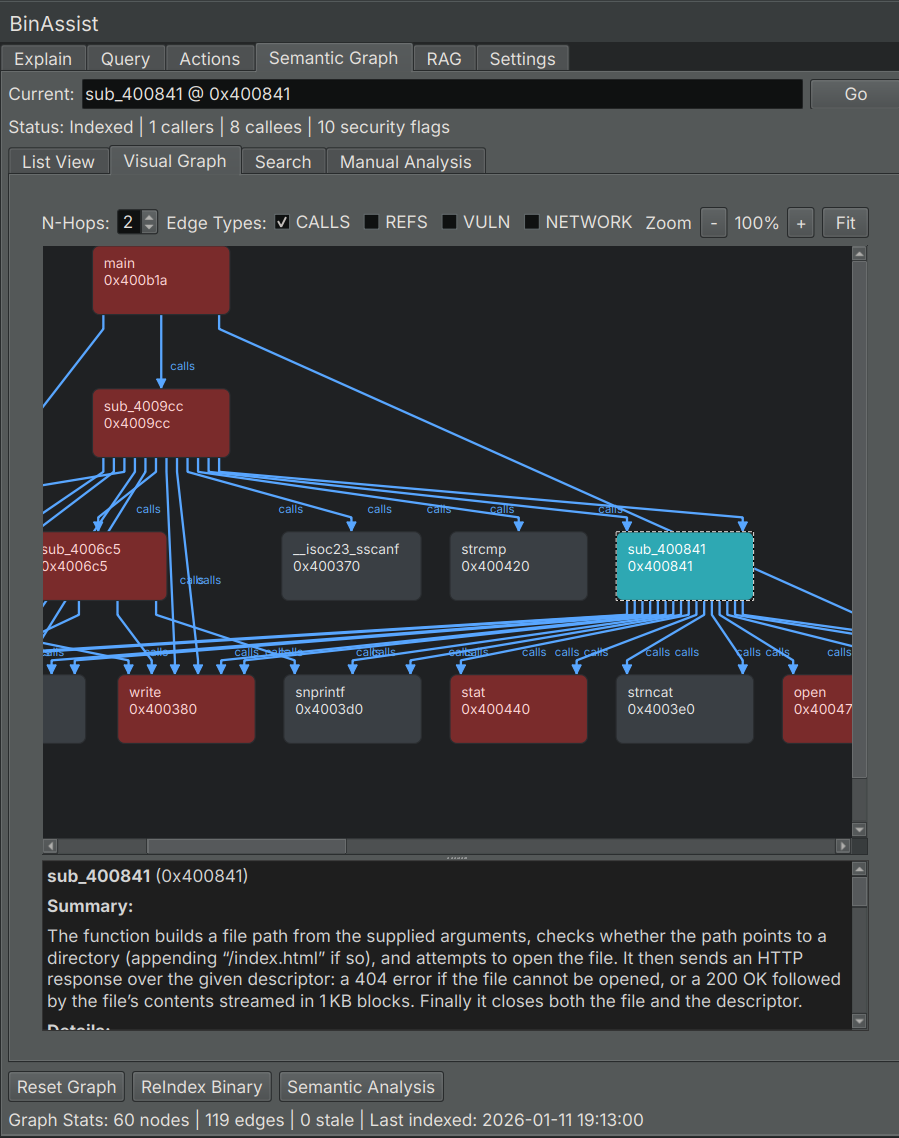
Visual Graph
Explore relationships visually: - Nodes represent functions - Edges show call relationships - Colors indicate communities or security flags - Click nodes for details
Search
Find functions by keyword: 1. Switch to the Search sub-tab 2. Enter keywords (function names, summary terms) 3. Review results with relevance scores
Using the Graph with LLM Queries
The semantic graph enhances LLM queries when MCP is enabled:
- Build the semantic graph (Steps 1-5 above)
- Go to the Query tab
- Enable MCP
- Ask questions that benefit from graph context
The LLM can now: - Query for functions by purpose - Find related functions - Trace call chains - Identify security-relevant code
Example queries: - “What functions handle network input?” - “Show me the call chain from main to any crypto functions” - “Which functions have high security risk?”
Incremental Updates
You don’t need to rebuild everything when the binary changes:
- ReIndex: Run after structural changes or when starting fresh
- Semantic Analysis: Run on functions that lack summaries
- Security Analysis: Run after semantic analysis or when checking for new patterns
- Community Detection: Run after significant changes to function relationships
Tips for Effective Graph Building
Start Small
For large binaries: 1. ReIndex to get the structure 2. Run Semantic Analysis on key functions first 3. Expand analysis as needed
Focus on Interesting Areas
Not every function needs deep analysis: - Entry points and exports - Functions with security flags - Functions in critical call paths
Iterate
The graph is a living resource: 1. Build initial graph 2. Use it in queries 3. Refine based on what you learn 4. Re-run analyses as understanding deepens
Combine with Manual Analysis
Use the graph alongside manual reverse engineering: - Graph shows the big picture - Manual analysis provides depth - Queries connect the two
Related Documentation
- Semantic Graph Tab Reference - UI element details
- Query Workflow - Using the graph in queries